Linearity and Saturation
Linearity regime and saturation level of CCDs have been determined from a set
of screen-flatfields of increasing integration time until the detector
is saturated (65535 ADUs).
Trying to avoid any dependence on the lamp heating, we took a sequence of
a short exposure (3-5 seconds), a longer one (300-500 seconds), an other one
a little longer than the first, an other one shorter than the second, the
next longer than the third one, and so on.
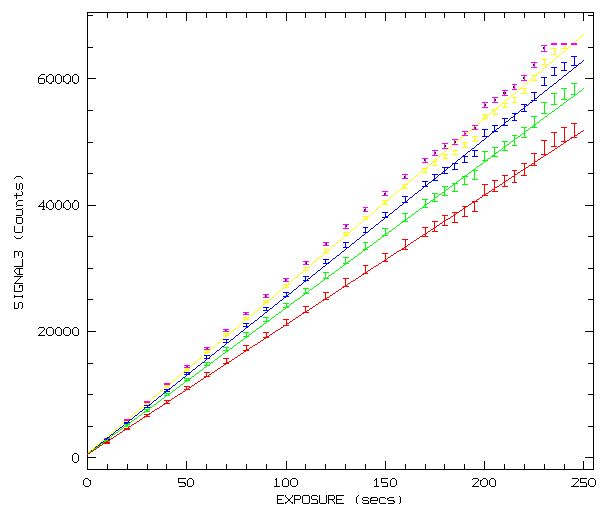
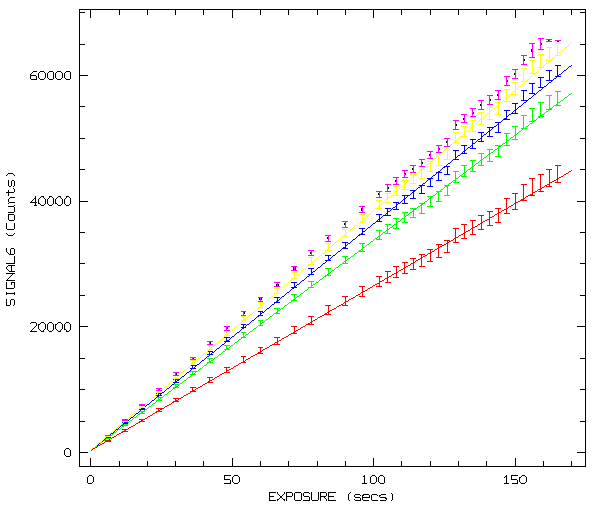
Next figures show the mean signal versus exposure time for both CCDs.
Different colors refer to windows in different regions of the same flatfield
image. Error bars are standard deviation measured in the same window than
the mean signal. Straight lines are linear fits.
Site#22b (Blue)

Site#20b (Red)

As can be seen in these figures there are some data points that deviate
significantly from the fit. That is because is very difficult to avoid
completely, lamp heating or any other undesirable effect during the
time (hours) needed to obtain these flatfield sequences.
Although, from these figures, we could say that the linearity regime of
both CCDs is up to the saturation level (65000 ADUs). To test it in a more
reliable way, we use the known formula for the variance :

where R is the readout noise, G the gain and
S the signal.
The third term is the fixed-pattern noise of the flatfield frame.
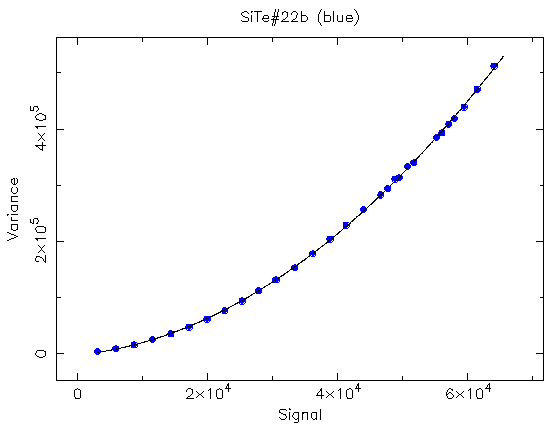
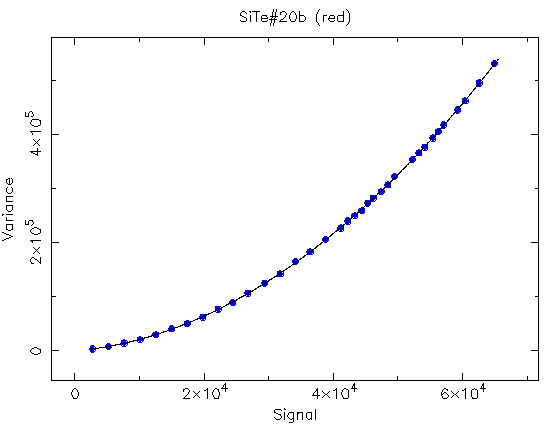
To look for the linearity range we can try to fit a parabola (y=a+bS+cS^2)
when plotting sigma^2 versus signal. Linearity ends when data start
to deviate from the parabola.
This has been done as shown in next figures . The parabola fit the
data along the whole range.


Santos Pedraz Marcos
Last modified: January 18 2001


